


An investor who bought into the S&P 500 at the Great Financial Crisis low of 2009 earned a 16% average annual return over the subsequent 15-year period through 2023. If, instead, they’d purchased at the dot-com bubble high in 2000 and held steady through 2023, they would have averaged only 7% per year.
Looking out over the next ten years, which return is more likely? And why?
In attempting to answer this, we can use a common shorthand for estimating stock market returns — income received plus capital appreciation. In other words, dividends received plus how much you expect stock prices to increase. A common way of decomposing this is to calculate the sum of three components — the dividend yield, an estimated growth rate, and the estimated change in valuation.
The easiest of these inputs to derive is the dividend yield, which is currently 1.4% for the S&P 500. Historically this is a very low yield – not much of a return driver here. By comparison, at the market low in 2009, the yield was 3.6%. And at the market high in 2000? 1.4%.
The second component is an estimated growth rate. Note that this is a growth rate for the economy, not an individual stock or sector. Because we’re forecasting aggregate stock returns, it is reasonable to assume they would track overall economic growth. Without getting too far into the weeds on the derivation, it is commonly expressed as labor growth plus productivity plus inflation, which would be 0.4% + 1.4% + 2.5% = 4.3%
Adding that 4.3% onto the dividend yield, we’re now up to 5.7% as our expected 10-year annual return.
The final input is the trickiest — forecasting the valuation change — because that reflects investor sentiment. That is, will investors be willing to pay more for a given level of growth or less? This can be influenced both by other available investment returns (riskless one-month US Treasury Bills at 5.4%, for example) and by enthusiasm (or lack thereof) about the prospects for economic growth. Using history as a guide and P/E (Price/Earnings) ratios as the measure, valuations today are about 20% higher than the 30-year historical average. Investors today are currently paying more for growth than they did before.
Putting all of that together:
- If valuations stay at their current high levels for the next ten years, a reasonable average annual return range would be 5.5% - 7.0%.
- But if stocks mean revert to the average P/E of the last 30 years, an average annual return of 3.5% – 4.5% could be more realistic.
Of course, all of this is simply analytical food for thought and not a prediction. Still, working through these numbers is a useful exercise as we contemplate possible return trajectories over the next decade.
In the interest of full disclosure — I confess I’ve been feeling some “dot-com déjà vu” lately.
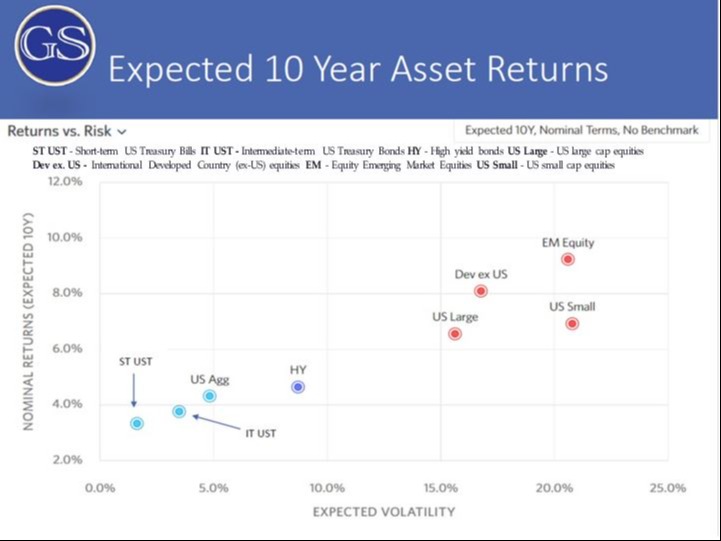
Source https://interactive.researchaffiliates.com/
This is a hypothetical example and is for illustrative purposes only. No specific investments were used in this example. Actual results will vary. Past performance does not guarantee future results. Investments are subject to risk, including the loss of principal. Some investments are not suitable for all investors, and there is no guarantee that any investing goal will be met. All indices are unmanaged, and investors cannot actually invest directly into an index. Unlike investments, indices do not incur management fees, charges, or expenses. Talk to your financial advisor before making any investing decisions